4 Price Action Candlestick Pattern You Mast Know ( Binary Option Reading Candle )
1. Doji
What does it look like?
It looks like a cross, with the same opening and closing prices.
2. MARUBOZU
What does it look like?
A Marubozu is the polar opposite of a Doji. Its opening price and closing price are at the extreme ends of the candlestick.
Visually, it is a block.
3. HARAMI CANDLESTICK
What does it look like?
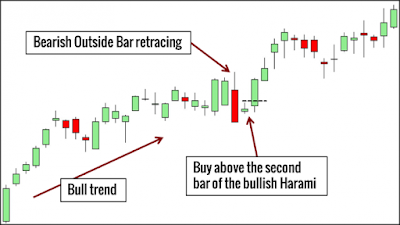
Just remember that Harami means pregnant in old Japanese. The first candlestick is the mother, and the second candlestick is the baby.
Focus on their bodies. The body of the baby kafe must be entirely within the body of the mother bar.
Typically, in a bullish Harami, the first kafe closes lower than it opens while the second kafe closes higher. Similarly, in a bearish Harami, the first kafe closes higher than it opens while the second kafe closes lower.
What does it look like?
Simply flip a Harami pattern horizontally and you will get an Engulfing pattern.
The body of the second candle completely engulfs the body of the first.
What does it mean?
Again, the focus on the candle bodies looks for a real reversal. In this case, the second candle body fully engulfs the first and represents a strong reversal signal.
How do we trade it?
In a bull trend, buy above the bullish Engulfing pattern for bullish continuation.
In a bear trend, sell below the bearish Engulfing pattern for bearish continuation.
What does it look like?
It looks like a cross, with the same opening and closing prices.
What does it mean ?
Simplel. in a doji candlesttick, price is essentially unchanged, Hence, it represnts market iindecison.
It'is like an area of congestion compressed into one candlesticak
How do we trade it ?
Trade it like a reversal signal ( if there is a animo to reverse)
Treat it as a signal to stand aside (if there is no animo to reverse
Read more : 5 The Most powerfull Candlesick Pattern
2. MARUBOZU
What does it look like?
A Marubozu is the polar opposite of a Doji. Its opening price and closing price are at the extreme ends of the candlestick.
Visually, it is a block.
What does it mean?
A Marubozu that closes higher signifies powerful bullish strength while one that closes lower shows extreme bearishness.
How do we trade it?
The Marubozu is more useful as a learning tool than as a pattern for trading. Together with the Doji candlestick, they highlight the extremes of the candlestick spectrum.
If you must trade the Marubozu pattern, consider the following.
Continuation pattern in a strong break-out aligned with the market bias
Part of another candlestick pattern (discussed below)
Just remember that Harami means pregnant in old Japanese. The first candlestick is the mother, and the second candlestick is the baby.
Focus on their bodies. The body of the baby kafe must be entirely within the body of the mother bar.
Typically, in a bullish Harami, the first kafe closes lower than it opens while the second kafe closes higher. Similarly, in a bearish Harami, the first kafe closes higher than it opens while the second kafe closes lower.
What does it mean?
It means that the market has come to a muted reversal.
The candle body stands for the real price change of the candle regardless of its intra-candle excursions. Hence, it represents the real and conclusive movement of the candlestick. The smaller candle bodies points to decreased volatility. Thus, it is not surprising that many Harami candlestick patterns are also inside bars.
Compared with the Engulfing candlestick pattern below, it is a weaker reversal pattern.
How do we trade it?
In a bull trend, use the bullish Harami to pinpoint the end of bearish retracement.
In a bear trend, use the bearish Harami to pinpoint the end of bullish retracement.
4. ENGULFING CANDLESTICK
What does it look like?
Simply flip a Harami pattern horizontally and you will get an Engulfing pattern.
The body of the second candle completely engulfs the body of the first.
Again, the focus on the candle bodies looks for a real reversal. In this case, the second candle body fully engulfs the first and represents a strong reversal signal.
How do we trade it?
In a bull trend, buy above the bullish Engulfing pattern for bullish continuation.
In a bear trend, sell below the bearish Engulfing pattern for bearish continuation.


Belum ada Komentar untuk "4 Price Action Candlestick Pattern You Mast Know ( Binary Option Reading Candle )"
Posting Komentar